


Automating Cluster Selection for Segmentation Tasks
The choice is still yours

In the realm of unsupervised machine learning, K-means clustering stands out as a popular method for data segmentation. However, one of the perennial challenges with K-means is selecting the optimal number of clusters (k). Without a clear-cut method to identify k, data scientists often rely on heuristic or trial-and-error approaches. To address this challenge, we introduce a systematic method using the kneed package, alongside scikit-learn, to automate the selection of the optimal number of clusters.
Understanding the Concept
The elbow method is a heuristic used in determining the number of clusters in a dataset. The method plots the explained variance as a function of the number of clusters, and you pick the elbow of the curve as the number of clusters to use. However, identifying the "elbow" point manually can be subjective. This is where the kneed package comes into play. It provides a way to algorithmically detect this elbow point, making the process objective and reproducible.
Deep Dive into the kneed Package
The kneed package, short for "Knee Detection," is a Python library designed to identify the knee point (or elbow point) in a curve. This functionality is particularly useful in various data science and machine learning tasks, such as determining the optimal number of clusters in K-means clustering through the elbow method, as we discussed earlier. The concept behind kneed is based on the idea that the knee or elbow of a curve represents a point of diminishing returns, where increases in the x-axis result in smaller gains on the y-axis.
Setting Up Your Environment
Before diving into the code, ensure you have the necessary packages installed. You can install scikit-learn for K-means clustering and kneed for detecting the elbow point. Use the following pip commands:
pip install scikit-learn kneedPreparing Your Data
For demonstration purposes, let's use a generated dataset:
from sklearn.datasets import make_blobs

# Generate synthetic data
X, _ = make_blobs(n_samples=1000, centers=3, cluster_std=0.60, random_state=42)
Applying K-Means with Various K
Now, we'll apply K-means clustering with a range of k values and calculate the inertia (sum of squared distances to the nearest cluster center) for each:
from sklearn.cluster import KMeans
import numpy as np

inertias = []

for k in range(1, 10):
    kmeans = KMeans(n_clusters=k, n_init=5, random_state=42).fit(X)
    inertias.append(kmeans.inertia_)
Using kneed to Find the Optimal K
With the inertias calculated for different k values, we can now use kneed to identify the elbow point:
from kneed import KneeLocator

kn = KneeLocator(K, inertias, curve='convex', direction='decreasing')
print(f"The optimal number of clusters is: {kn.knee}")
Visualizing the Elbow Curve
Visualizing the elbow curve not only helps in understanding the distribution but also in validating the kneed package's selection:
import matplotlib.pyplot as plt

plt.figure(figsize=(8, 6))
plt.plot(K, inertias, 'bx-')
plt.xlabel('Number of clusters')
plt.ylabel('Inertia')
plt.title('The Elbow Method showing the optimal k')
plt.vlines(kn.knee, plt.ylim()[0], plt.ylim()[1], linestyles='dashed')
plt.show()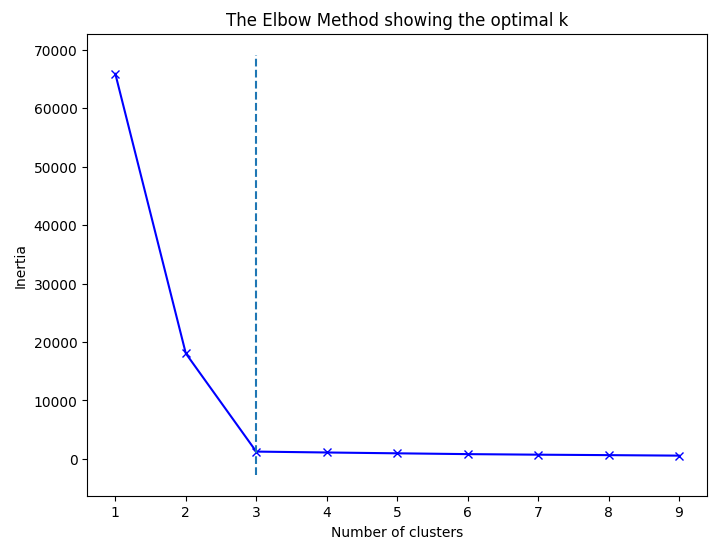
Applying K-Means with the Optimal K
Now, you can apply K-means clustering using the optimal number of clusters found:
optimal_kmeans = KMeans(n_clusters=kn.knee, random_state=0).fit(X)Plotting Clusters
Once you have applied K-means clustering using the optimal number of clusters as determined by kneed, you can plot the results to visualize how the data points are grouped into clusters. This step is crucial for interpreting the clustering outcome and gaining insights into the dataset's structure.
# Predict the cluster for each data point
y_kmeans = optimal_kmeans.predict(X)

# Plot the clusters
plt.figure(figsize=(10, 6))
plt.scatter(X[:, 0], X[:, 1], c=y_kmeans, s=50, cmap='viridis')

centers = optimal_kmeans.cluster_centers_
plt.scatter(centers[:, 0], centers[:, 1], c='red', s=200, alpha=0.5, marker='X')
plt.title('Clusters with Optimal K')
plt.xlabel('Feature 1')
plt.ylabel('Feature 2')
plt.show()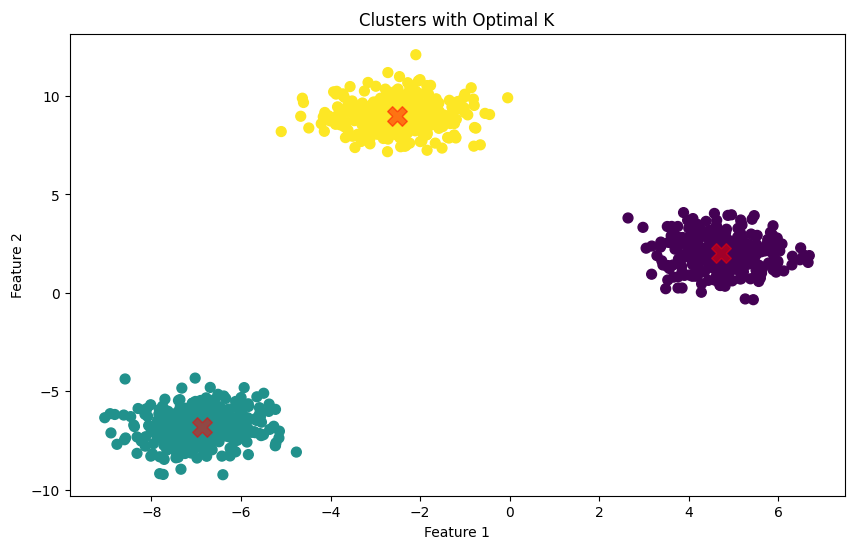
Conclusion
In summary, automating the selection of the number of clusters for segmentation tasks with kneed and K-means is a powerful technique that balances efficiency with flexibility. It significantly reduces the manual effort involved in cluster analysis, allowing data scientists and analysts to allocate more time to the strategic aspects of their work. Whether you choose to accept the suggested number of clusters or adjust it, this method ensures that your decision is data-driven, providing a strong foundation for successful segmentation.
Stay hungry for data recipes!